Mac OS X, Ubuntu Linux, Network traffic monitor
Written by Guillermo Garron
Date: 2013-01-30 19:07:13 00:00
There are a lot of times when you need to monitor the network traffic of a server, if you are using a *nix server like Linux or Mac OS X then you can use vnstat.
To install it on Ubuntu:
sudo apt-get install vnstat
For Mac
brew install vnstat
Measure the traffic daily and monthly
vnstat
The output will be::
   eth0 since 01/28/13

          rx:  521.49 MiB      tx:  2.73 GiB      total:  3.23 GiB

   monthly
                     rx      |     tx      |    total    |   avg. rate
     ------------------------+-------------+-------------+---------------
       Jan '13    521.49 MiB |    2.73 GiB |    3.23 GiB |   10.48 kbit/s
     ------------------------+-------------+-------------+---------------
     estimated       538 MiB |    2.82 GiB |    3.34 GiB |

   daily
                     rx      |     tx      |    total    |   avg. rate
     ------------------------+-------------+-------------+---------------
     yesterday    137.45 MiB |  953.60 MiB |    1.07 GiB |  103.45 kbit/s
         today    142.05 MiB |  931.85 MiB |    1.05 GiB |  104.23 kbit/s
     ------------------------+-------------+-------------+---------------
     estimated       145 MiB |     953 MiB |    1.07 GiB |
Daily output
vnstat -d
The output::
 eth0  /  daily

         day         rx      |     tx      |    total    |   avg. rate
     ------------------------+-------------+-------------+---------------
      01/28/13    241.98 MiB |  905.03 MiB |    1.12 GiB |  108.75 kbit/s
      01/29/13    137.45 MiB |  953.60 MiB |    1.07 GiB |  103.45 kbit/s
      01/30/13    142.46 MiB |  933.96 MiB |    1.05 GiB |  104.10 kbit/s
     ------------------------+-------------+-------------+---------------
     estimated       144 MiB |     952 MiB |    1.07 GiB |
Monthly output
vnstat -m
The output::
 eth0  /  monthly

       month        rx      |     tx      |    total    |   avg. rate
    ------------------------+-------------+-------------+---------------
      Jan '13    521.89 MiB |    2.73 GiB |    3.24 GiB |   10.48 kbit/s
    ------------------------+-------------+-------------+---------------
    estimated       538 MiB |    2.82 GiB |    3.34 GiB |
Hourly traffic
vnstat -h
The output::
 eth0                                                                     23:31
  ^                                                      t
  |                                                      t
  |                                                t     t
  |                              t  t  t     t  t  t  t  t  t  t     t
  |                           t  t  t  t  t  t  t  t  t  t  t  t  t  t  t
  |                     t  t  t  t  t  t  t  t  t  t  t  t  t  t  t  t  t
  |   t  t  t     t  t  t  t  t  t  t  t  t  t  t  t  t  t  t  t  t  t  t
  |   t  t  t  t  t  t  t  t  t  t  t  t  t  t  t  t  t  t  t  t  t  t  t
  |   t  t  t  t  t  t  t  t  t  t  t  t  t  t  t  t  t  t  t  t  t  t  t  t
  |  rt rt  t  t  t  t  t  t rt rt rt rt  t rt rt rt rt rt rt rt  t rt rt  t
 -+--------------------------------------------------------------------------->
  |  00 01 02 03 04 05 06 07 08 09 10 11 12 13 14 15 16 17 18 19 20 21 22 23

 h  rx (KiB)   tx (KiB)      h  rx (KiB)   tx (KiB)      h  rx (KiB)   tx (KiB)
00       6501      27893    08       6556      43288    16       6889      50251
01       6350      29656    09       6397      46482    17       7138      63410
02       5327      28186    10       6785      46341    18       6612      46859
03       4874      23707    11       6568      46753    19       6571      44559
04       5160      29429    12       6282      43262    20       6223      43502
05       4685      25453    13       6693      49926    21       6614      44780
06       5040      32282    14       6558      46707    22       6390      38441
07       5456      35727    15       7528      54614    23       2682      14867
Linux exclusive - vnstati
If you are working with Linux, you can also graph the info from vnstat, with vnstati. To install it on Ubuntu.
sudo apt-get install vnstati
Here some examples of the vnstati command, and the output of them:
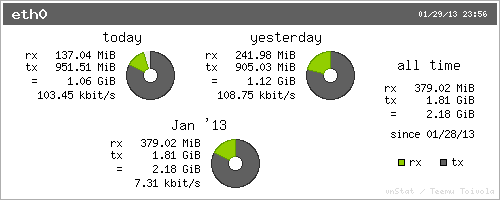
vnstati -s -i eth0 -o /tmp/vnstat-s.png
The output is something like this:
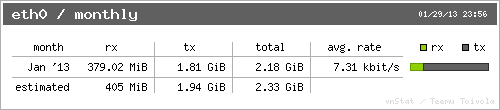
vnstati -m -i eth0 -o /tmp/vnstat-m.png
The output is something like this:
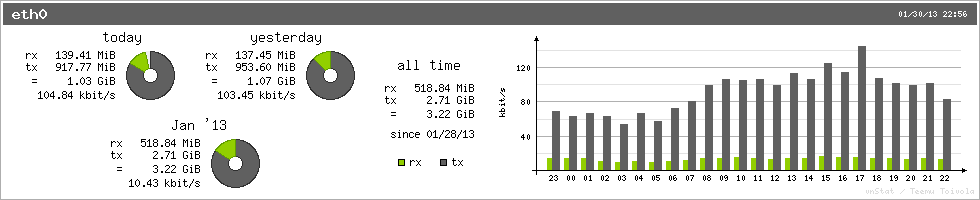
vnstati -h -hs -o /tmp/vnstat_hs.png
The output is something like this: